One of the key strengths of the abs(etf) platform is a focus on the fast growing Fixed Income ETFs segment. We offer a number of bespoke services in this area, but the ‘Replication‘ section has a selection of our most powerful tools. The first option is ‘Basic‘ which allows you to replicate a selection of popular ETFs using a smaller number of instruments. Select a fund to replicate, select how many bonds you wish to use and click ‘Run Replication‘. The system will try to optimally select a cross section of bonds within the fund and then optimise that portfolio to match the duration, convexity, rating and average maturity of the ETF.
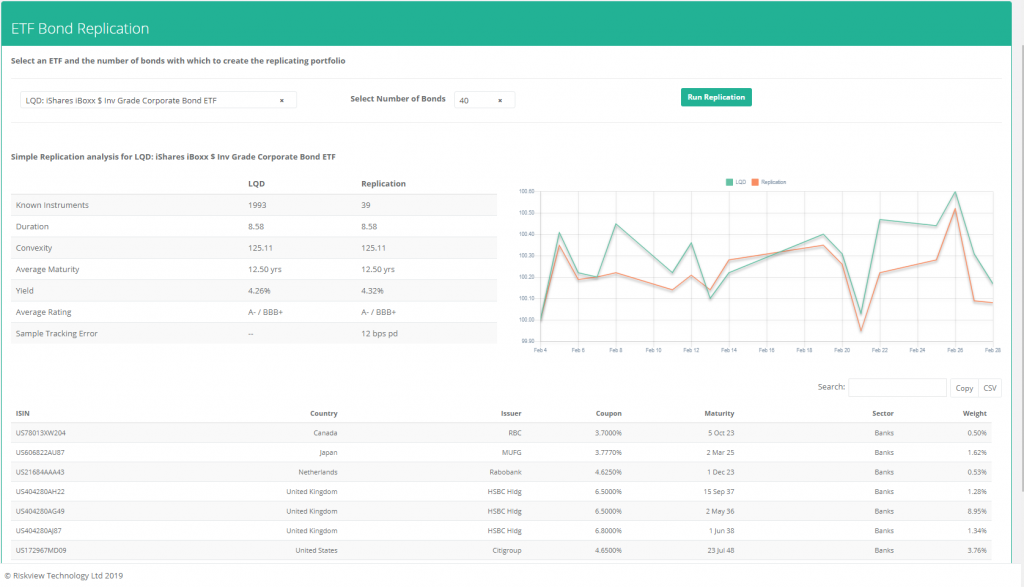
Here we can see the statistics for the ETF and the replicating portfolio as well as an estimate of the daily tracking error in basis points per day. The chart shows the relative performance historically, and the table below shows the detail of the bonds chosen – this table can easily be copied using the ‘Copy‘ button and pasted into Excel, or alternatively exported to ‘CSV‘ for later use. For a select group of US ETFs we also offer replication using Futures and CDX – as before select the fund, and then choose the replication method. For Government (Treasury) Bond funds you can replicate using futures, but for corporate indices you can overlay the futures replication with CDX. This can be calculated based on spot CDX and ETF yields, or based on recent history to match performance. An example is shown below:
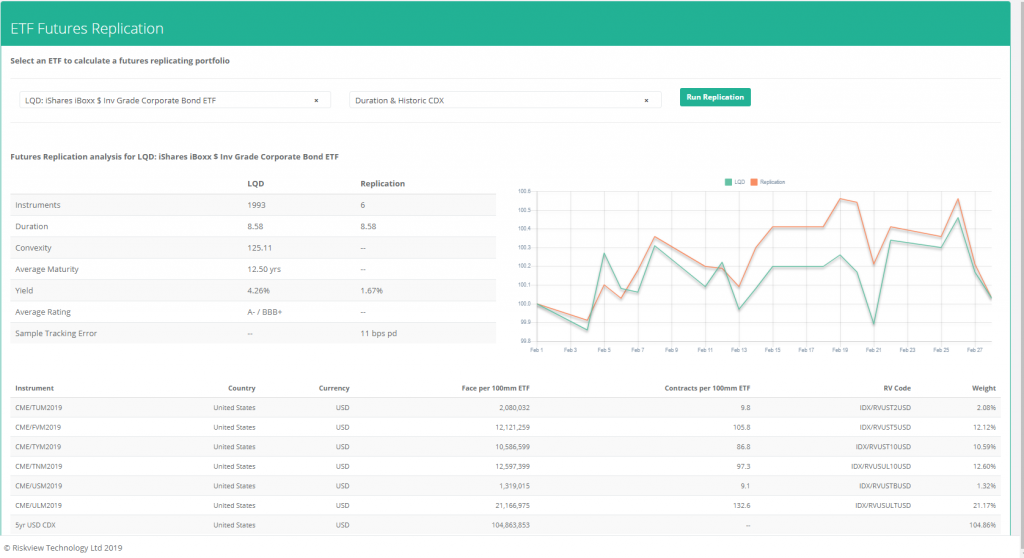
As shown the system automatically selects the most appropriate futures to use and attempts to match the duration of the ETF – the futures and number of contracts per $100 million of the ETF are shown in the table. Any CDX overlay is shown at the bottom of the table.
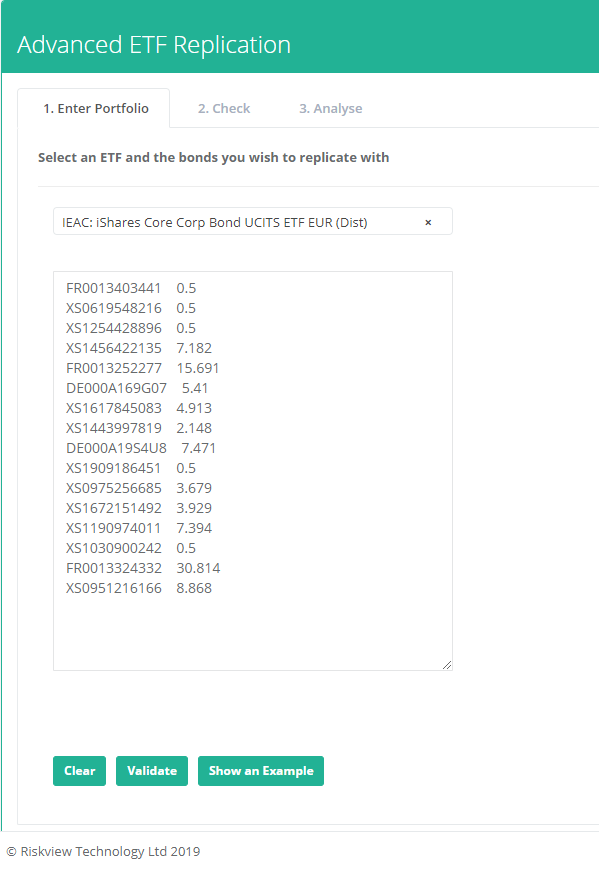
As a preview we also present an Advanced replication option which allows you to enter a portfolio of bonds and analyse it vs the ETF. As per the ‘Portfolio’ tabs, you once again require two columns of data – bond ISINS in the first column and weights in the second. The weights should be in terms of cash value (not par) and should not have any special characters (e.g. $, commas etc). If you unsure of the format, click ‘Show an Example’ and a sample portfolio will be filled in as per the screen below:
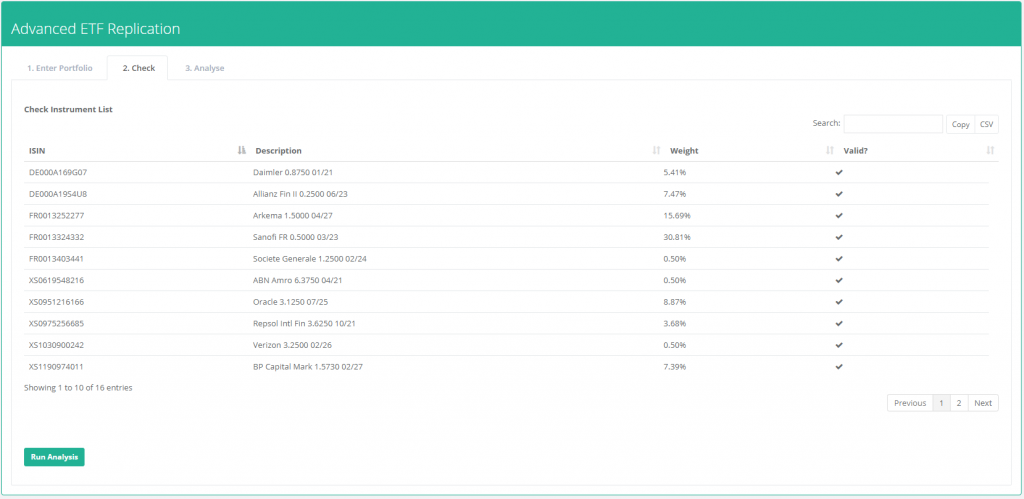
As before once you are happy with your selection click on ‘Validate‘ which will check each of the instruments, and whether they are actually in the current ETF composition. Once validated you should see the following:
At this point you can hit ‘Run Analysis‘ which gives the following:
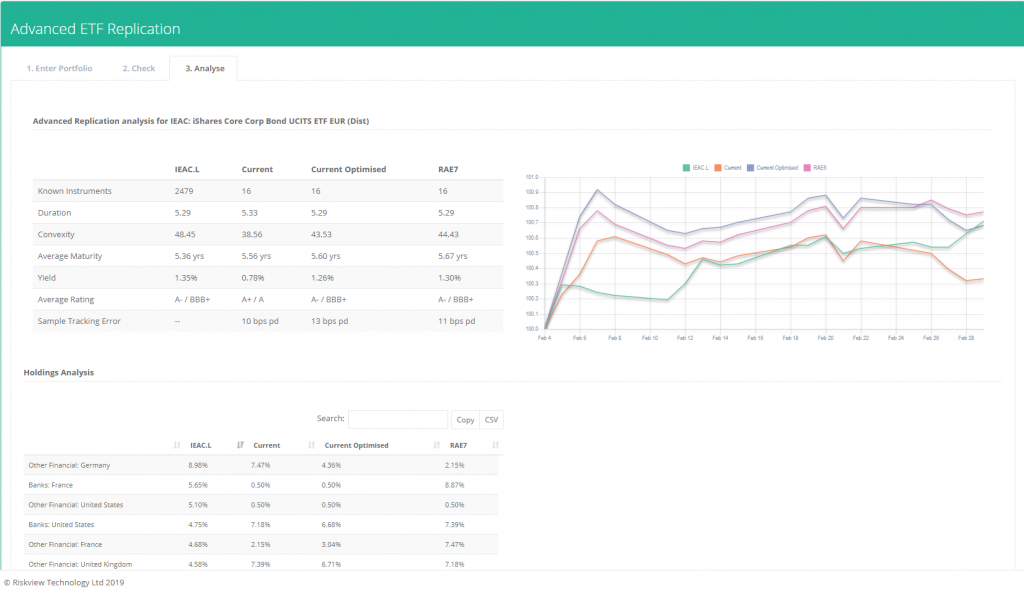
Here we can see statistics for a number of portfolios – the first is the ETF, and the second is the current portfolio. The third column is a portfolio which optimises the weights vs the ETF but using the bonds in the current portfolio – the idea being to show potential tweaks to the existing portfolio which could improve it’s tracking error vs the ETF. The final portfolio is what the system would choose given the number of bonds in the portfolio – which offers a comparison to the current portfolio.
These features give a good overview of the analysis available – please contact us for more information or any customisation at info@riskview.io. A an example is the Custom Baskets solution in the next section.
