Once you have found a number funds you are interested in, we can analyse portfolios of ETFs easily using the ‘Portfolios‘ menu on the left hand side. First stop – click ‘Create‘. This gives you a text box in which you can dump your portfolio – the easiest way is a copy and paste from an Excel sheet
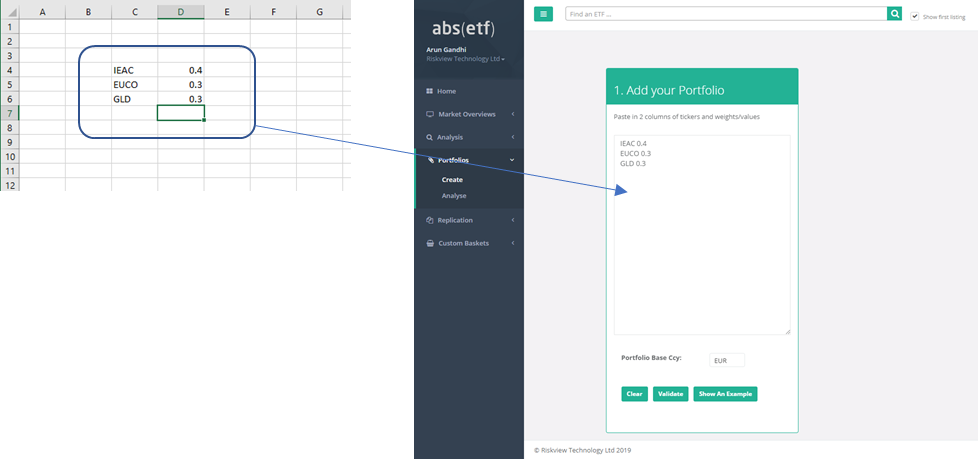
The portfolio must be in the form of two columns – the first column should contain the identifier – ISIN, ticker, CUSIP etc. The second column should be a number representing the weight of the ETF in the portfolio – e.g. 0.5 = 50%. You can use any figures here such as market values, percentages etc, but there should be no characters within the numbers such as commas or percentage signs or you will see an error. You can of course just type in a portfolio manually, and the ‘Show an Example‘ button will give you an example portfolio to get you started. At this point you can select a Base Currency for the portfolio – all ETFs not denominated in this currency will be FX translated on a daily basis. Once you are happy with the selections click on the ‘Validate‘ button – this checks that the system can interpret what you’ve entered properly, and if successful you should see something like this:
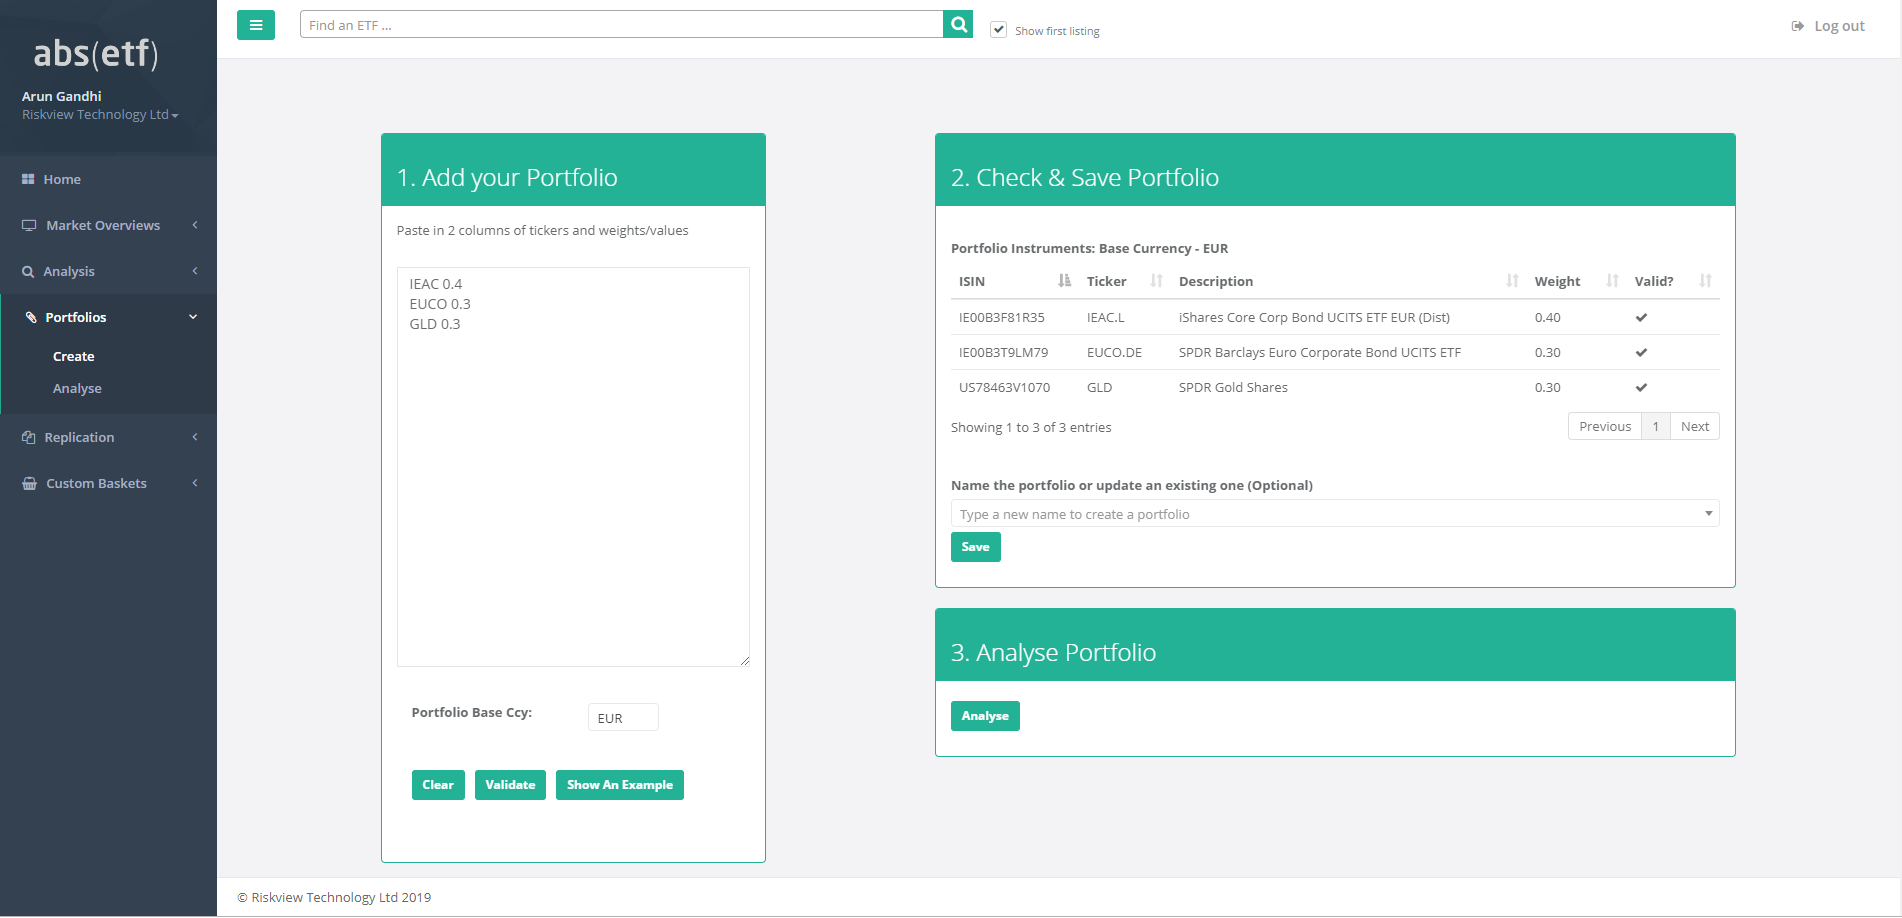
As shown all the items have been validated – you should check that the funds are correct. If you wish to save the portfolio for future analysis you can enter a name and do so with the ‘Save‘ button – alternatively selecting an existing portfolio will overwrite with the current selection. Next click the ‘Analyse‘ button in Section 3. After a few seconds you should come to an Analysis screen such as the one below:
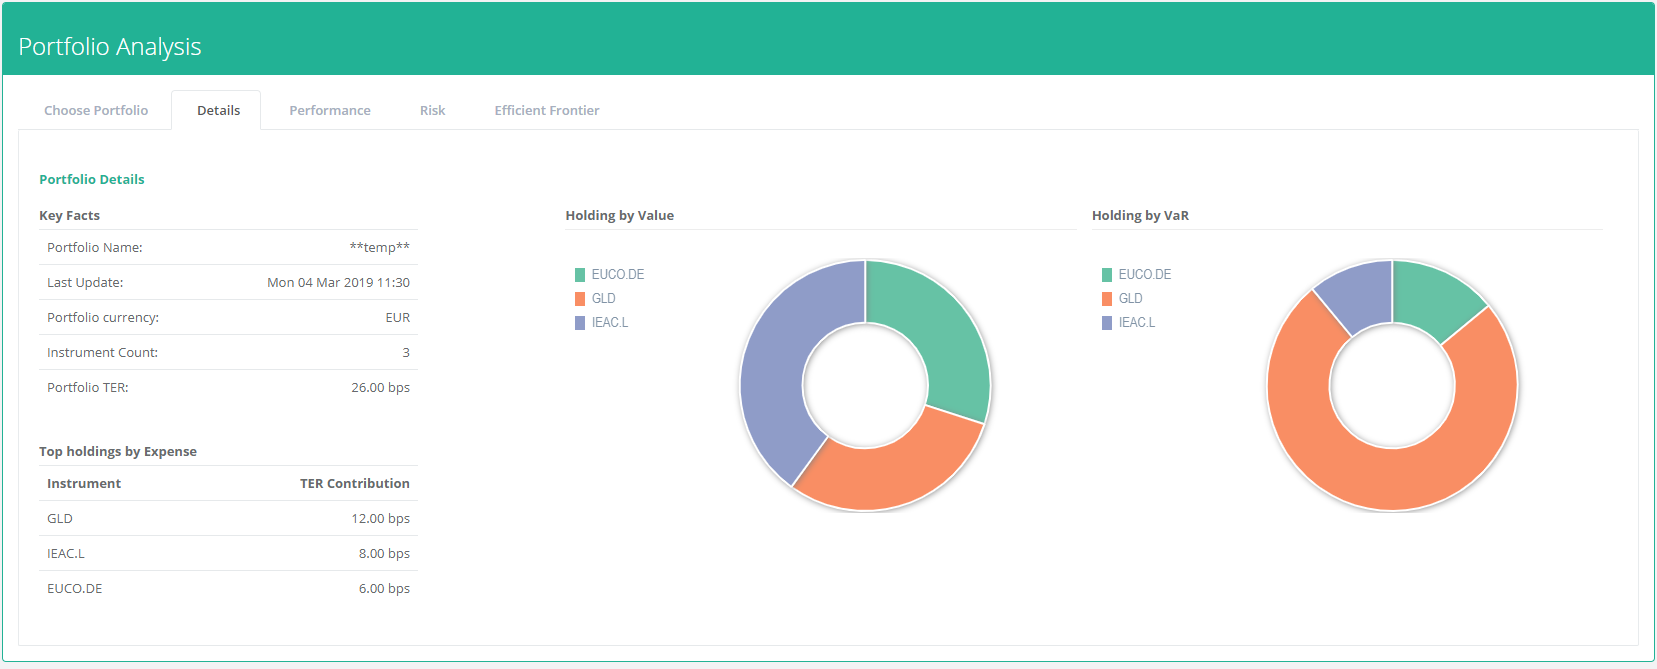
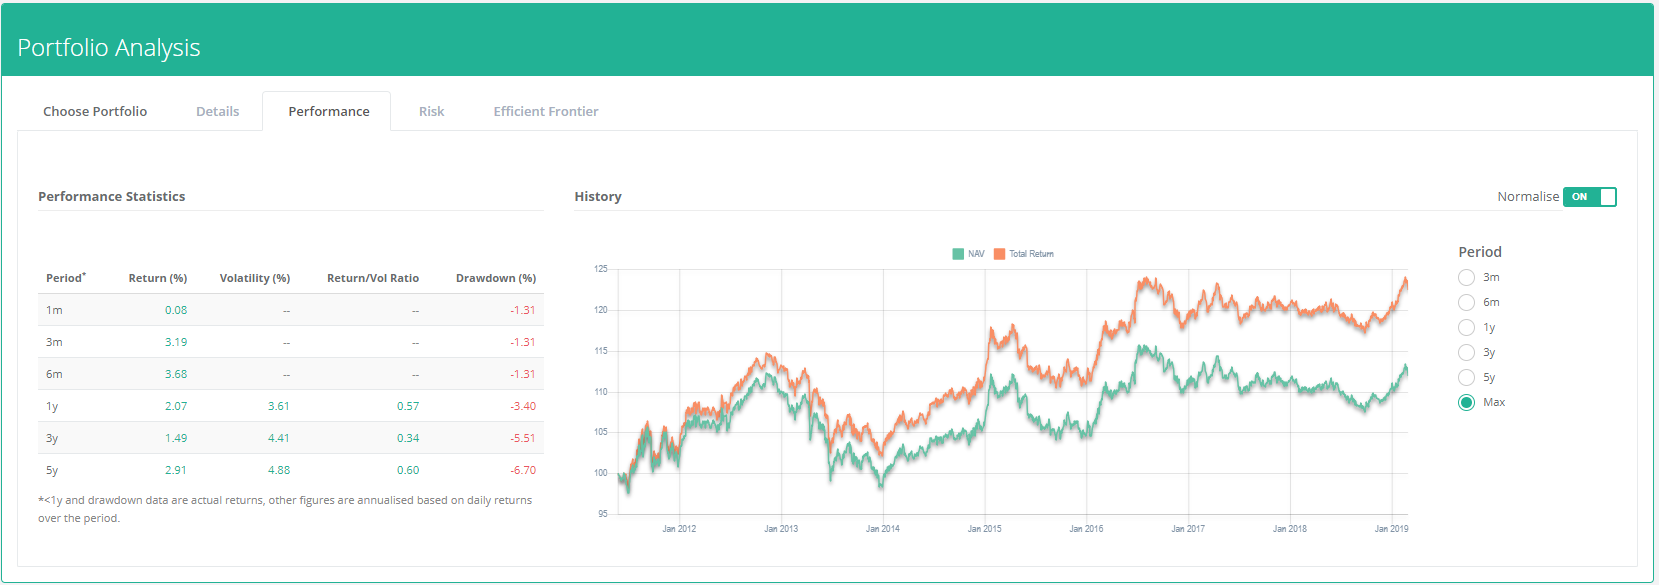
Here we can see some basic details about our portfolio – on the left we can see some statistics including the Average Expense Ratio and which ETFs are contributing the most. The charts show the holding by value and VaR – the latter aims to show how the risk is distributed among the top holdings of the portfolio. Moving on to the ‘Performance‘ tab we can see the portfolio price and total return over various periods
In the ‘Risk‘ tab we can see a more detailed analysis of the risks of each individual component. The table shows the volatility, the volatility beta relative to the portfolio (i.e. is the component more or less risky than the overall portfolio), the VaR and CVaR, the Marginal VaR/CVaR (the change in VaR for a 1% change in the weight of that portfolio component) and the Decremental VaR/CVaR – the change in the VaR of the portfolio if that component was removed. For more information on each of these measures see our primer on VaR here. These statistics can quickly help you identify the sources of risk in your portfolio. The final tab is the ‘Efficient Frontier‘ tab – which gives us the following:
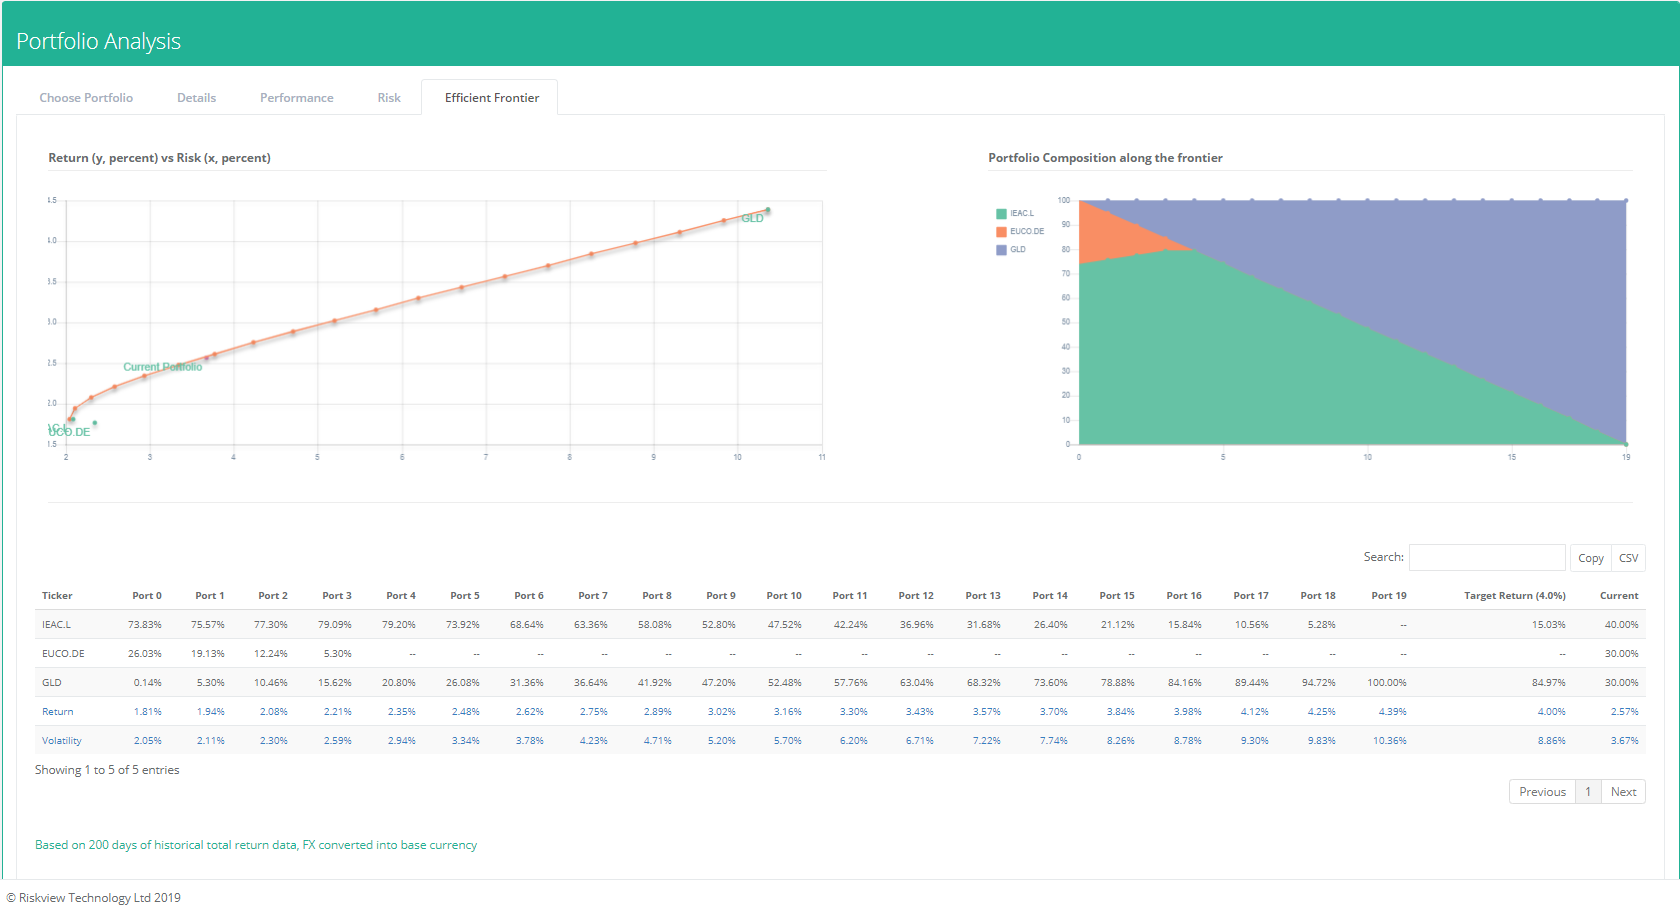
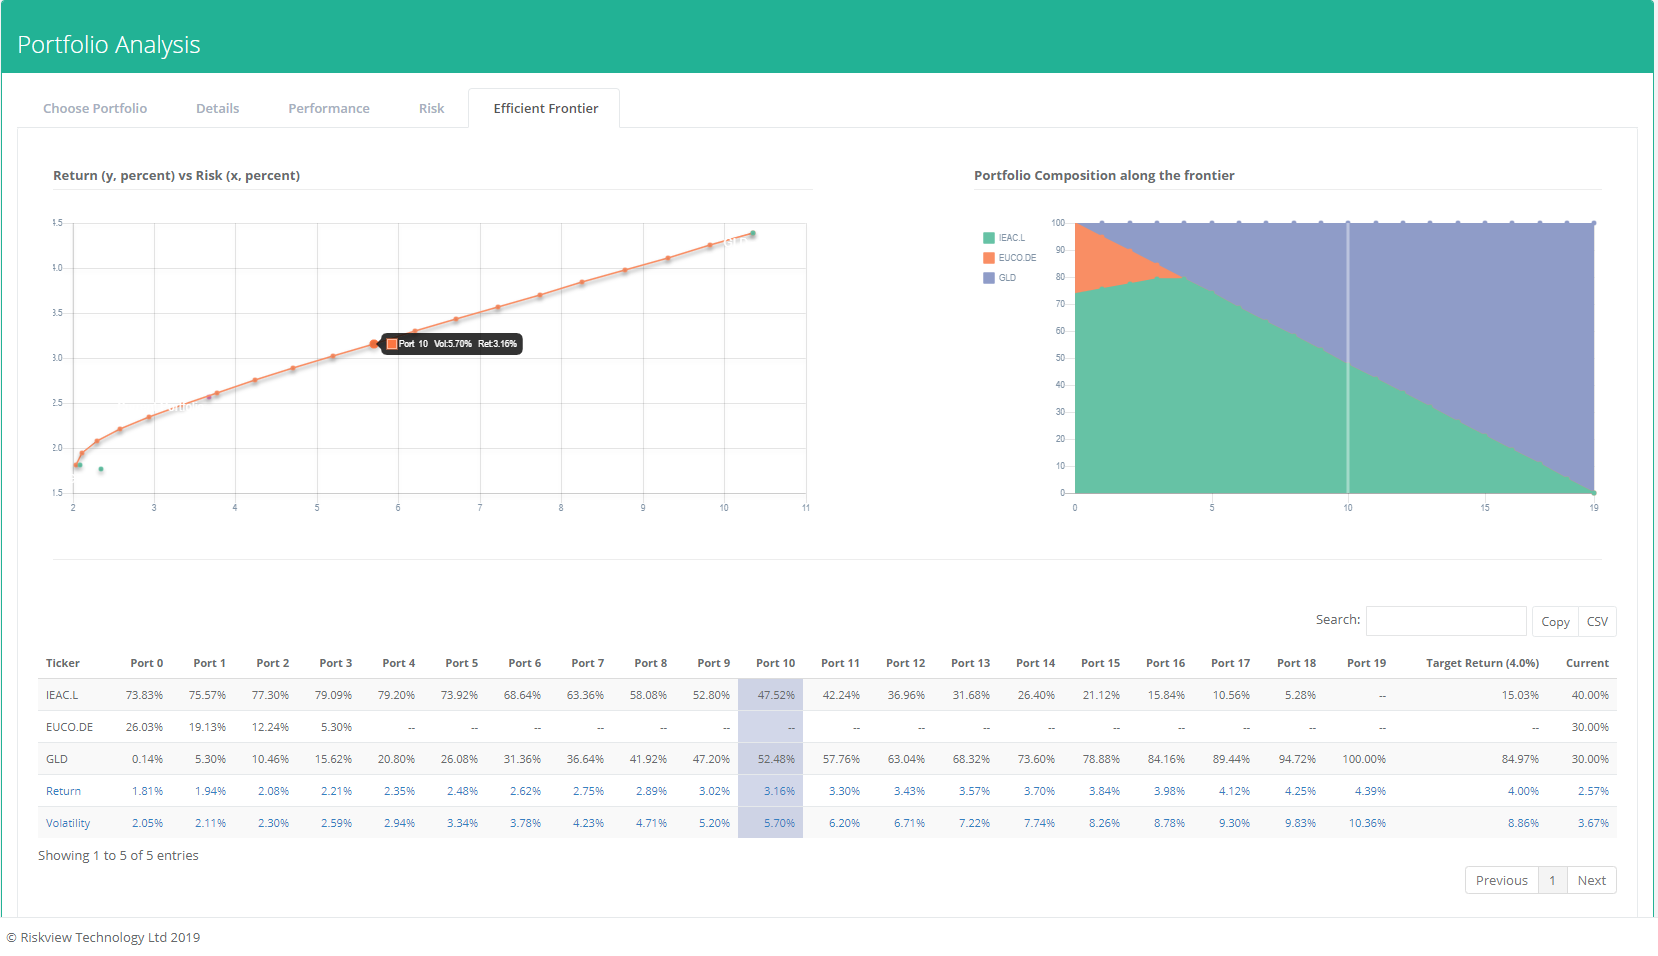
This shows an efficient frontier created from the components of the portfolio. Each individual component is shown in terms of it’s risk and return, with an additional dot for the current portfolio. If you move your mouse over a specific portfolio on the top left chart, it’s composition will be highlighted on the table and the top right chart like this:
These powerful tools should help you manage and analyse even the most complex multi currency ETF portfolio. For more advanced and bespoke analysis, please contact us at info@riskview.io
Our next section is concentrated on replicating Fixed Income ETFs.