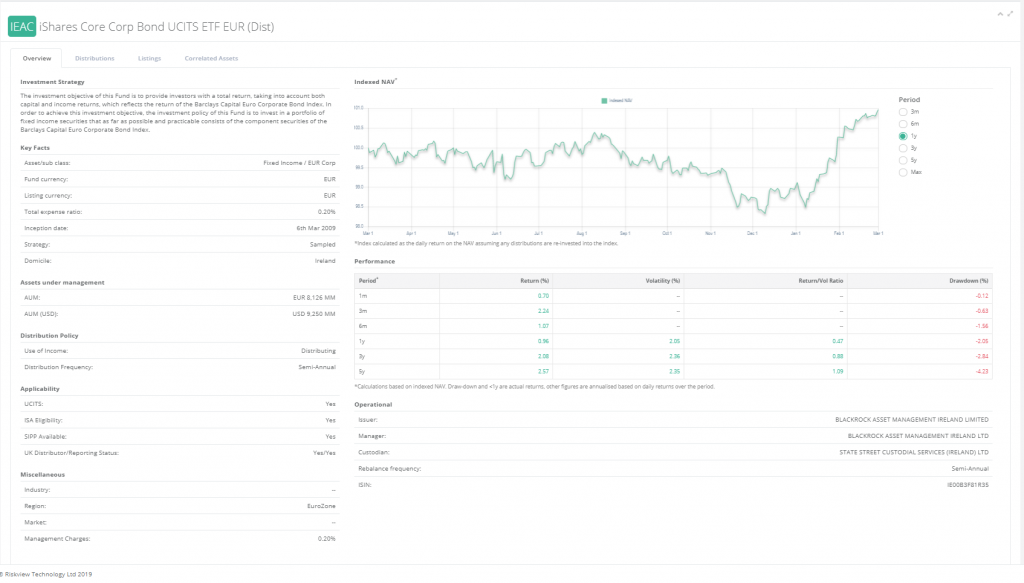
Once you select a fund you are interested in through the search, the system displays common information and return performance as shown below:

You can of course adjust the total return graph and use your mouse to inspect individual points. Using the tabs at the top of the page, if you click on ‘Listings‘ you can see the individual tickers we capture for this particular base fund – an example is shown below. ‘Distributions’ as the name suggests shows the latest dividends (if any) from the fund.

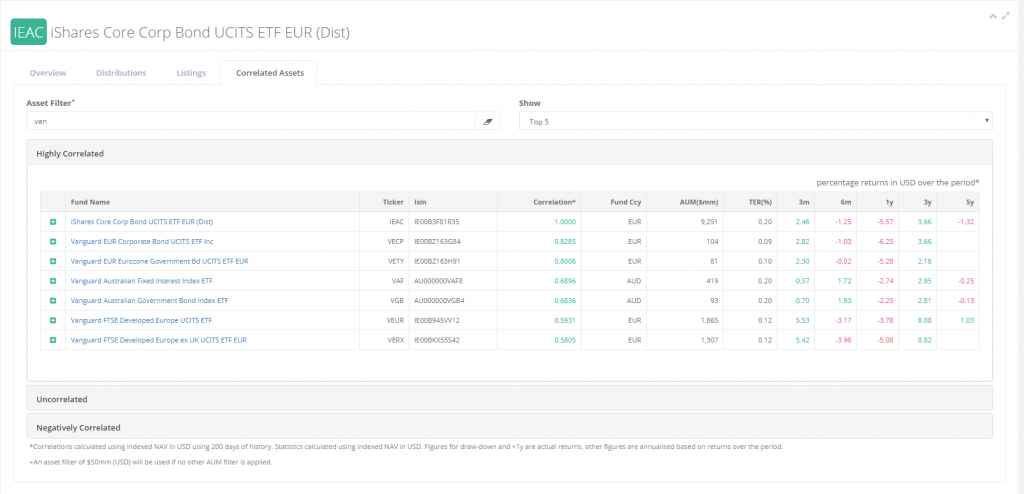
Finally on this page the ‘Correlations’ tab – one of the most powerful features of abs(etf). This tab shows all the funds which have a high, low or negative correlation to the fund we are interested in. As with the search bar you can filter the results by keywords or use the advanced filters such as ‘<0.1‘ to specify an expense ratio as shown below:

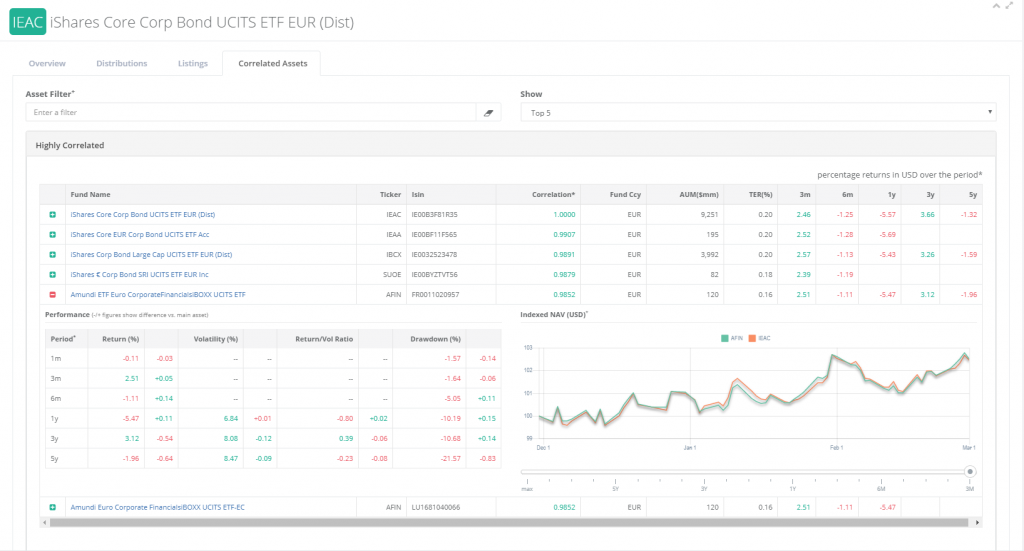
Clicking on the fund will take you to it’s page and clicking on the green ‘+’ show you more information on the selected option including a comparative historical graph

This section shows detail on individual funds – for a bigger picture approach however you can look at the Market Overview section.
