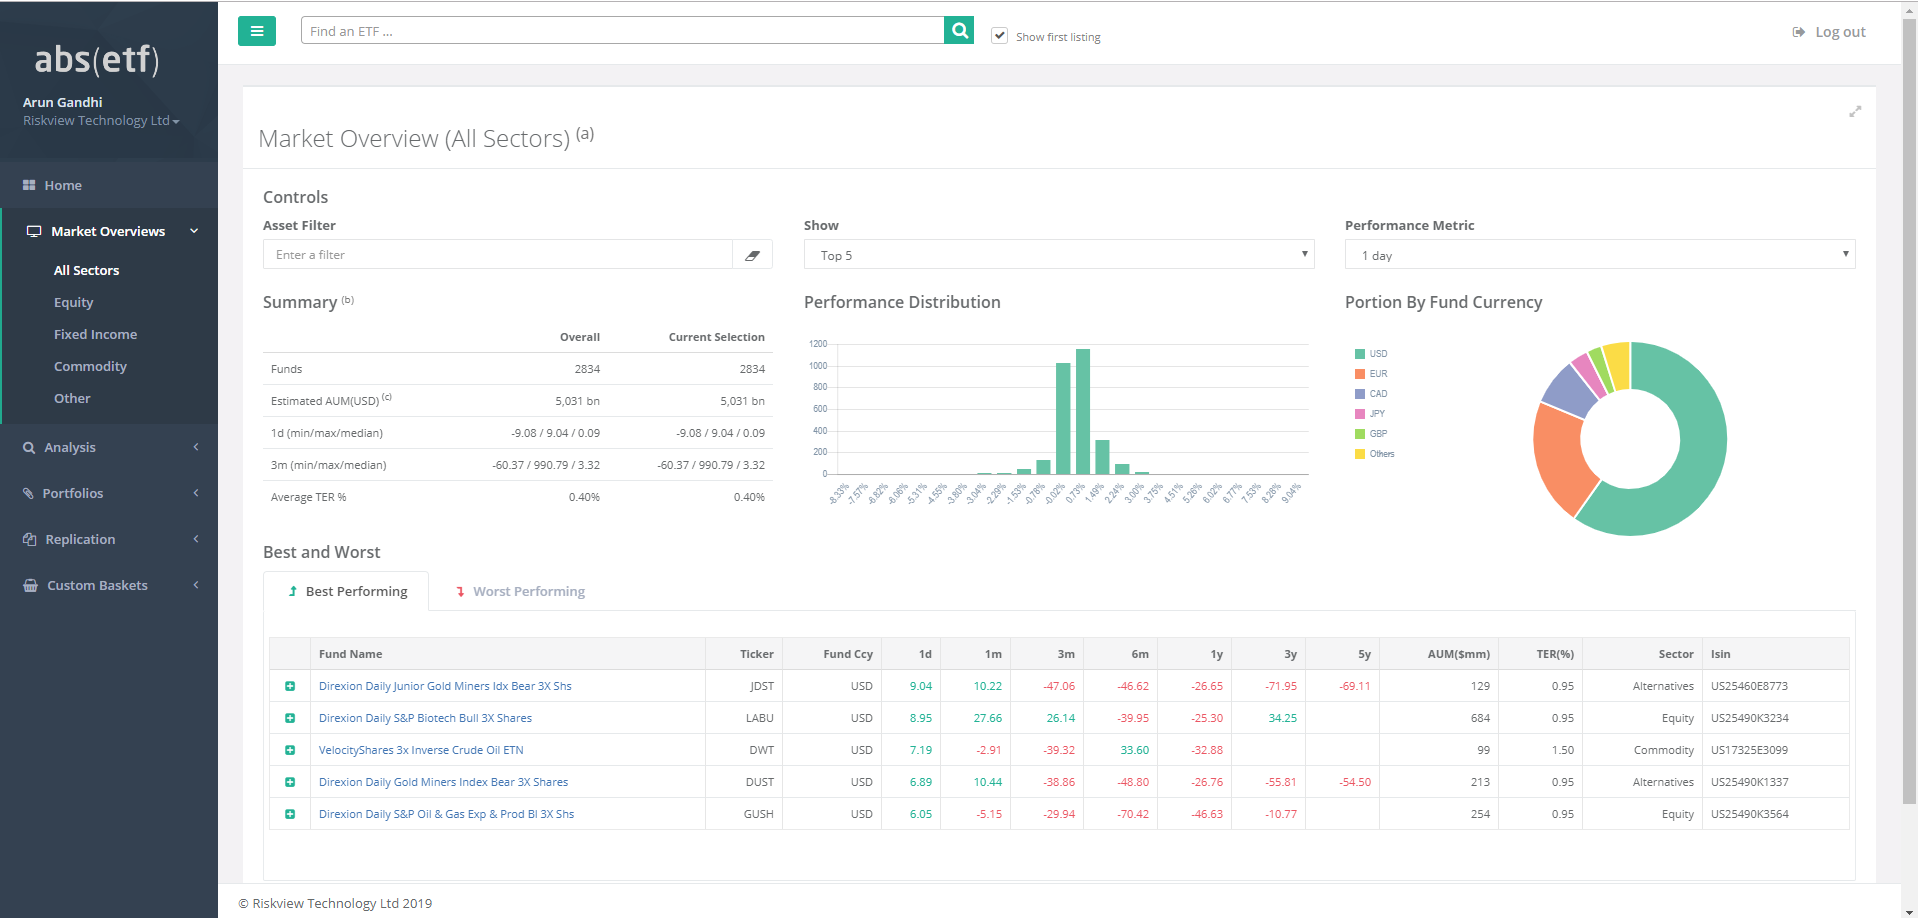
For the 30,000ft overview of the whole ETF market, select the ‘Market Overviews’ section from the left hand menu. You can select the whole market (subject to an AUM > 50mm to remove very small funds), or filter by particular asset classes. Selecting a ‘1 Day‘ Performance Metric from the drop-down gives the screen below. As before you can click on an individual fund to get more information or click on the green ‘+‘ to get a summary.
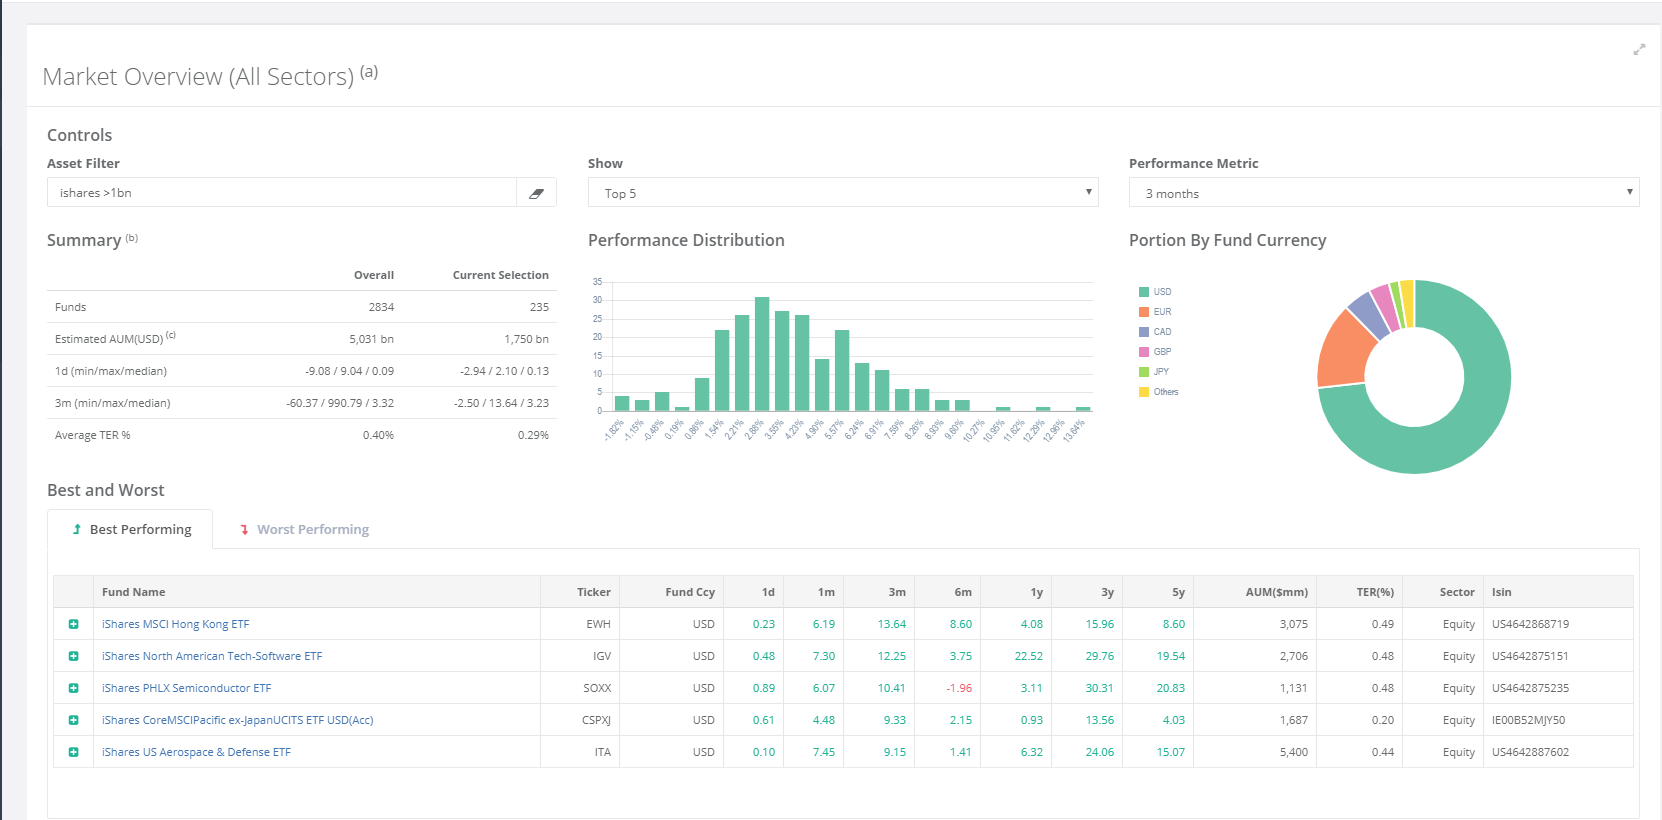
From here we can of course use our filters (see the ‘Search‘ page) to get information on groups of funds using all the usual keywords and AUM/TER filters as shown in the example below which looks at performance over 3 months
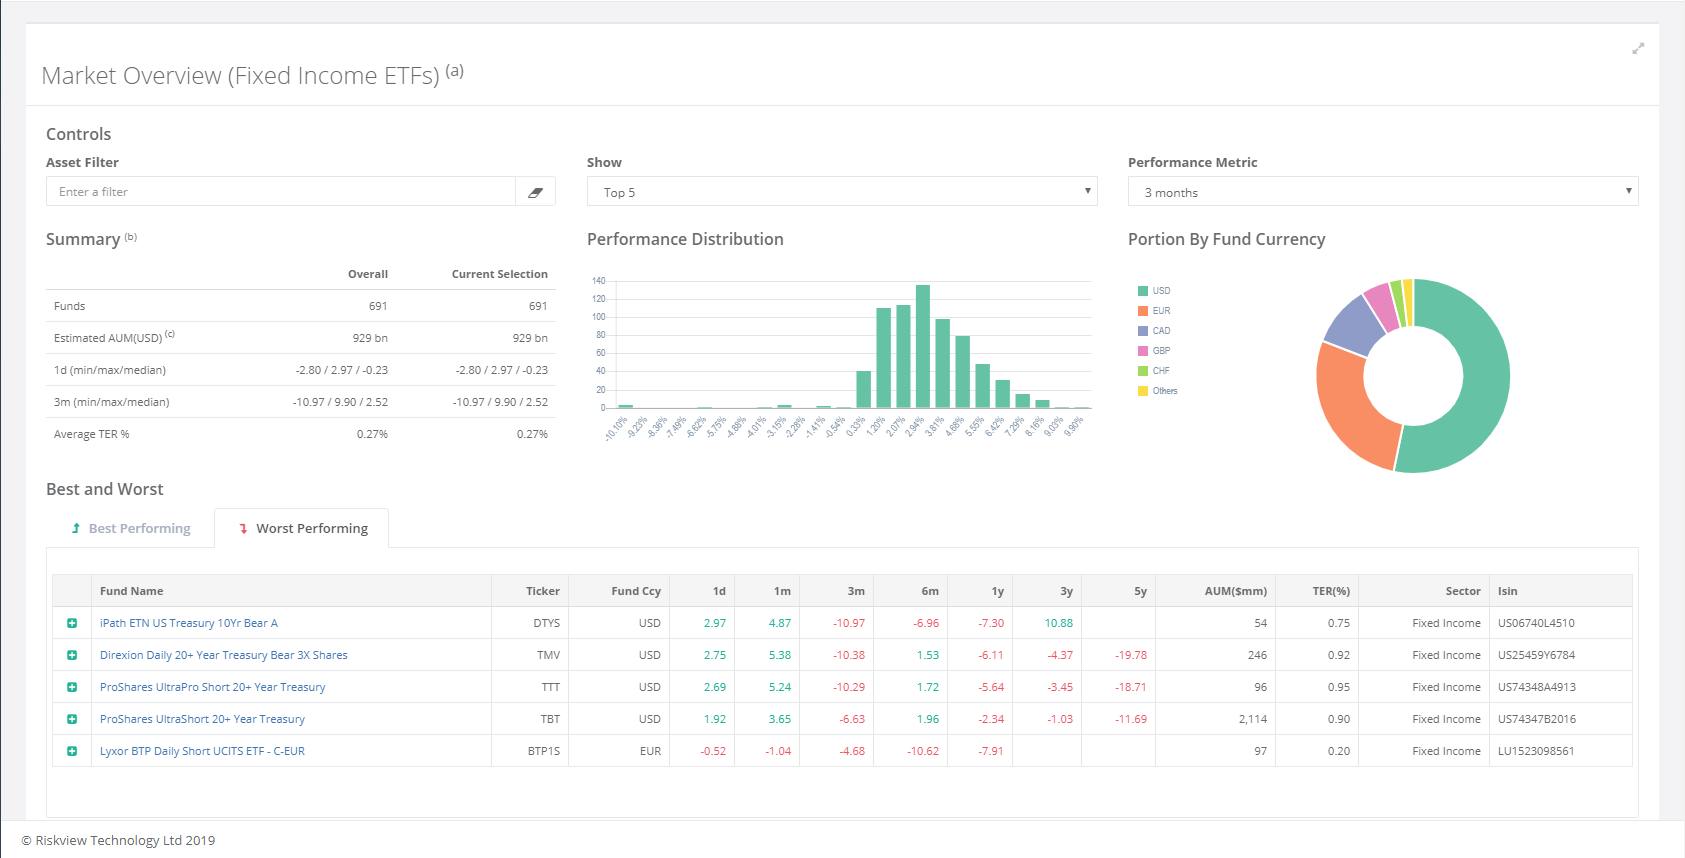
Of course we can combine these filters and selections – selecting ‘Fixed Income‘ from the left menu, selecting 3 Month and looking at the ‘Worst Performing‘ shows the screen below.
Once you have a portfolio of funds you are interested in, we can start analysing your selections in the ‘Portfolios‘ section.