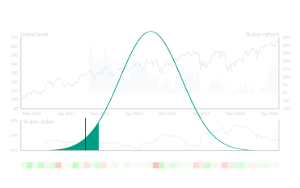
Introduction – I may be in a timewarp. In the dim and distant past I sat beside the team who were creating the original Riskmetrics framework and VaR was the new New Thing to get a handle on the risk of losses from your careful portfolio selection/punting in the markets. Fast forward twenty years and while VaR’s credibility has been battered by numerous Black Swans1, it still remains a core part of the risk manager’s armoury in financial markets. As I recently tried to dredge out the long forgotten knowledge of how to calculate it, and with the onset of Basel III and its focus on VaR’s cousin Expected Shortfall, it seems like a good time to commit some of the basics to print. In this series we’ll start with some simple definitions, move on to some real-world examples and then see how the measures cope with events such as Brexit (spoiler, not great).
Definitions – There are plenty of sources for the mathematical definition, but let’s stick (mostly) to words:
VaR – Value at Risk. It’s the minimum amount of money you expect to lose over a specified time period with a certain degree of confidence. For example, a portfolio VaR could be quoted as being the expectation of losing more than $100,000 in one day in every 20 trading days (a 95% confidence interval). Immediately you can see the appeal – it nicely distils a huge amount of detail on a potentially complex and multi asset portfolio into a single easily digestible number. As with any real-world simplification however the trade-off is assumptions – the big one being that the future will look a lot like the (recent) history and that statistically improbable events just don’t happen very often. The ‘more than $100,000’ bit is also a bit vague on how much you’re actually likely to lose. Basle III’s answer is:
Expected Shortfall (ES) – also known as Conditional VaR or CVaR. This very roughly is the average amount you expect to lose in the scenario that you make a loss greater than your VaR. So rather than expecting to lose more than $100,000 one in every 20 trading days, when you do make the loss on average you would expect it to be say $125,000. Again the ‘assumption’ alarm bells should be ringing, but ES is arguably a better way to express expected losses. It also has the advantage of being statistically more pleasant.
Calculation – So with those definitions we move on to how we actually calculate something. Here we again have three broad choices – historical, parametric and simulation:
Historical – Use the history of the actual portfolio and see what the actual losses were. This ideally requires a long and relevant history of the current portfolio, but if that is satisfied you could end up with a good handle on the future
Parametric – This method tries to fit a simple distribution to the returns of the portfolio and then estimate from there – all well and good if your distribution fits reality
Simulation – aka Monte Carlo2 – this uses random simulations to generate returns which can follow any number of complex rules to try and mirror reality. While more flexible it can lead to the Garbage In, Gospel Out phenomenon.
In the next post we’ll look at some actual numbers for a mixture of US stocks, ETFs and Riskview Futures Indices covering a range of asset classes for each of these measures and see how they stack up.
1 You can insert your own mental imagery here, or if you’re a budding cartoonist, drop me a line.
2 I am slightly confused as to why given the recent reputation of finance, people still choose to imply comparisons to a casino…

