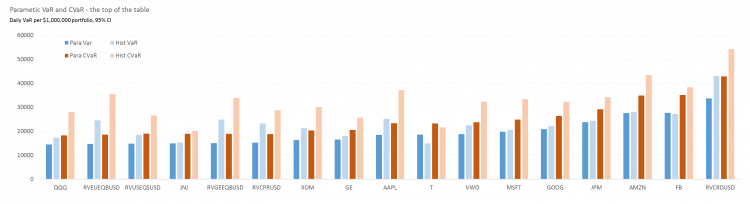
Following on from the Introduction to VaR, lets get our hands a bit dirty and look at some real world numbers. For want of a better starting place, the charts below show the risk of investing in a universe of 14 stocks, ETFs and futures trackers from the perspective of a USD based investor. They assume an investment of $1 million in each asset and show the daily 95% VaR and CVaR using both a historical and parametric approach. Lets start with the 7 assets with the smallest parametric VaR:
For starters we can look at the general trends in the numbers. As a nice sanity check the CVaR (red) numbers are always larger than the VaR (blue) when computed using the same method (important caveat), and eyeballing the data the historic (lighter) bars are generally higher than their parametric (darker) equivalents. The former observation we’d expect (if you’re not sure why, time to look over the intro again), but the latter – that the loss calculated using the actual historic data is generally higher than the parametric calculations – seems to imply that there have been more extreme events in this sample period than a simple statistical model would expect. In the lingo the actual historical distribution has ‘fatter tails’ than a simple, normally distributed model might predict. Is this important? Well if you were investing in Japanese Equity futures (the second group from the right – RVJPEQBUSD), the parametric method would have said your daily VaR was around $14k a day – the figure based on historical data is more like $29k a day! It’s an extreme example looking at the charts, but it’s a good lesson for any aspiring risk manager to know where their risk numbers come from and how they are calculated – and more importantly perhaps to treat all their risk numbers with appropriate suspicion.
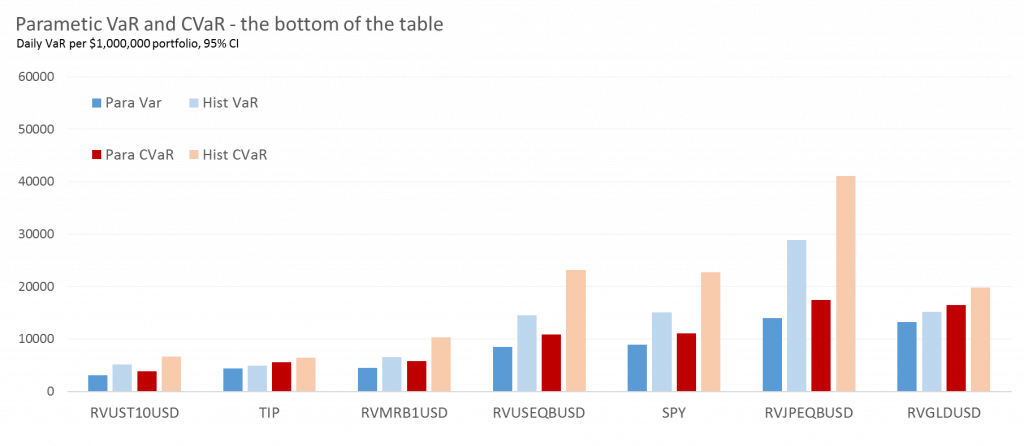
Broadly in terms of asset classes the bottom or less risky end of the league table seems to have a strong contingent of fixed income – US10yr Treasury Futures and TIPs are traditionally the safer (more boring) end of the risk spectrum – VaR numbers here are $3-4k/day. The exception is MARBLE (RVMRB1USD) – a multi asset rotator which can invest in Equities, Commodities and Fixed Income, but with a volatility target to limit the risk – and as we can see it seems to be working. As we move into the mid table we have broad equity markets (SPY, RVUSEQBUSD) and the top of this group (but in the middle overall) seems to be Gold with a VaR approaching $15k/day. Moving on to the top 7 largest VaR assets:
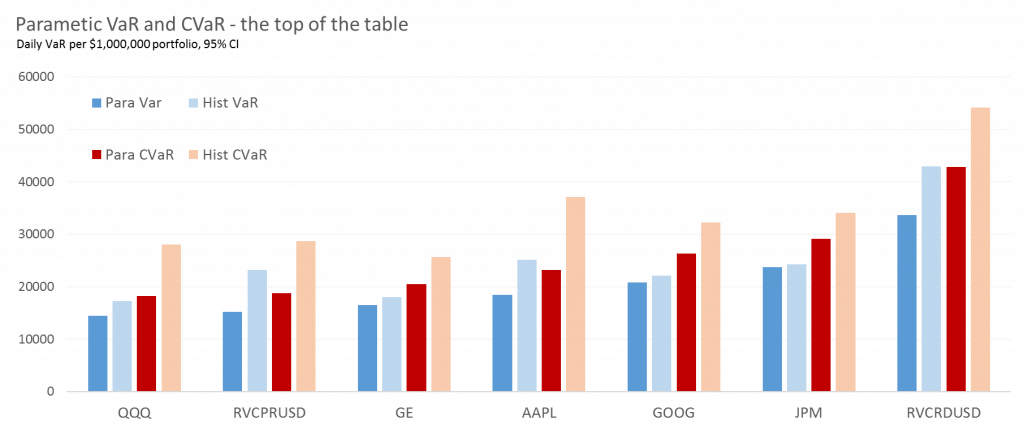
The top of the table is where the action is, volatility wise. Here we see the indices give way to single stocks, each of which are significantly more volatile that their overall market – AAPL (Apple Inc) is probably one of the best known and is in the middle of the pack tipping the scales at around $18k/day in parametric VaR. If you want the scarier version, using a historical estimation, on days where you exceed your VaR threshold, your expected loss (CVaR) is $37k. However in this class there can only be one winner, the granddaddy by a fair margin and top of the Vol pops are Crude Oil futures at the far right. Oil is famous for it’s price instability and with implied volatility numbers from options peaking over 100%, not one for the faint of heart. A punt on oil futures could see you losing an average of $54K on those VaR busting days. While that may not sound like a disaster compared to the portfolio size we’ve chosen of $1 million (~5%), you have to remember these are futures which through the joy of leverage means you could potentially get your $1 million dollars of exposure for less than say $100,000 of margin – on those bad VaR days you could easily lose over half your actual investment.
All said and done though, the numbers seem to make broadly intuitive sense – bonds are more stable, stocks are more volatile and crude is crazy. While the numbers may vary depending on the method (and the time period chosen), they are a reasonable guide to the risk of holding a position. One of the key (mis)selling points of VaR however is as a forward looking tool – and in the next post we’ll gaze into the crystal VaR ball (with the total benefit of hindsight) and see how these measures perform over time in the real world.
Hi Arun –
How are you constructing the parametric VaR models? Shouldnt you choose a distribution with parameters that match the tail of the historical distribution?
Hi – as a baseline I’m using ye olde Riskmetrics flavour of VaR – exponentially weighted returns with a lambda of 0.94, normal distribution, 95% CI. You absolutely could use a more advanced distribution or analysis but my personal view is that if you are going to use a parametric method at all keeping it computationally simple, consistent and broadly intuitive while appreciating its limitations isn’t a terrible way to go.