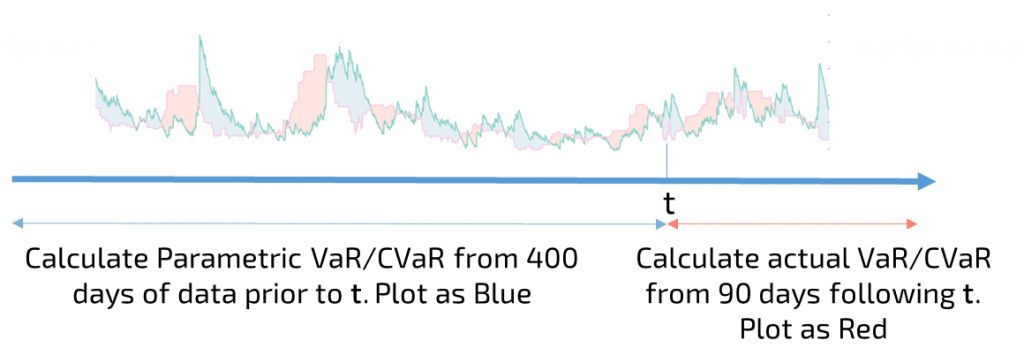
In our previous posts we looked at the definitions of VaR and CVaR/Expected Shortfall in the intro and some real world but point in time numbers in part two. In this post we’re going to try and wrap up with a look at the performance of a simple parametric VaR/CVaR measure over time. In order to get a handle on how these simple VaR measures perform, I’m going to set up some analysis using real-world numbers. The graphic below shows how the analysis works – at any point in time, t, I work out the VaR using the 400 days of historical data up-to and including t – this rolling series is the blue line. The red line shows what the actual VaR was over the next 90 days1 following t. Where the actual VaR was higher than the ‘predicted’ the difference is shaded red, where the actual VaR was lower it’s shaded blue. For each asset the top chart shows the VaR, and the bottom chart shows the CVaR/Expected Shortfall.
So with that explanation out of the way, lets look at some actual numbers. The charts below show the history for a few example cases – first up, US Equity futures. Just looking at the right of the charts from 2012 onwards shows on the whole VaR and CVaR doing a pretty decent job in matching the actual figures in the following periods. Sure there is a fair margin of error at times, but at this scale the right hand side of the charts look reassuring – for all the talk of fat tails and history being a poor predictor, as far as the last 4 years are concerned VaR broadly works, and CVaR although telling a largely similar story, mostly works too.
While the last few years are more ‘salt flats’ on the risk front, the middle of these charts are a bit more ‘Himalayas’ – no prizes for guessing what all the excitement was in 2008. For our purposes the large red and blue areas from 2008-2012 tell us all was not well in the kingdom of risk – so what happened (apart from a mini meltdown of the global economy)? VaR/CVaR are by their very natures historical estimates – all you have are the historic point in time data with which to run your analysis (and therefore the blue line) – the old ‘trying to drive a car by looking out of the rear window’ adage. The upshot is that it’s only after something significant happens will your VaR numbers actually start reflecting the change in the form of bigger expected losses. The red line would be really very useful in spotting impending disaster, but unfortunately it’s only available to (probably slightly smug) reviewers of history. And with the spike comes the hangover – the blue shaded area post the initial spike shows that having been rattled by the big move, both measures continue to overestimate future losses as they still have a recent memory of bad things happening.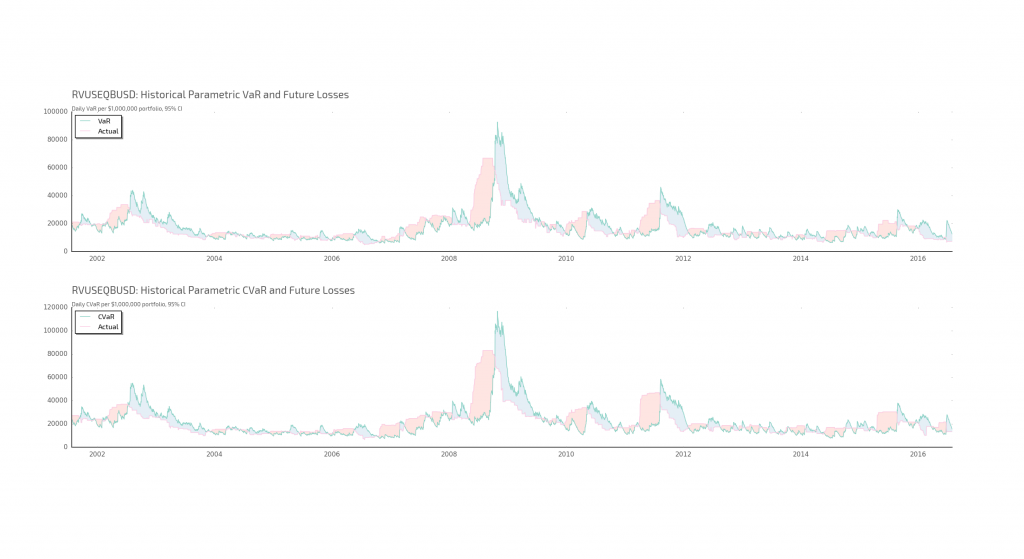
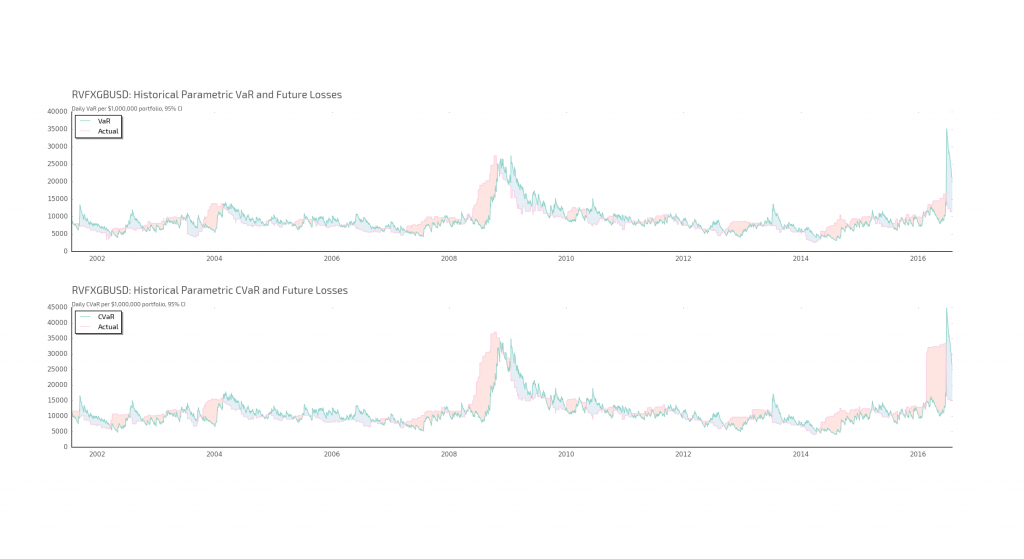
The theme is not uncommon in the other asset classes – below we have GBP currency futures risk which tells a somewhat similar story. The overall tracking doesn’t look too bad for the most part – the exceptions being 2008 and the Brexit bang at the end. It does raise an interesting and slightly related point – the move you can see is based on closing prices and while it will reflect the post-Brexit sell off, it won’t reflect the mini ‘flash-crash’ in GBP FX that happened shortly afterwards but during a trading day. Why does that matter? Well if the data we are using is close to close, the VaR numbers that come out only estimate how much you might expect to lose *at the close*. During the day potential losses could be a lot higher if trading in some hours, especially in Asia hours these days, is significantly more volatile than at other times of the day i.e. the times when the closing prices are recorded.
Another interesting feature on this chart however is the difference between the actual VaR and CVaR figures around the Brexit Bang at the end. As shown the actual CVaR is much higher than and closer to the the historical estimates compared to the VaR – so the average loss over the 5th percentile was significantly higher than the actual 5th percentile loss. In plain English the scale and nature of the move meant that while the losses weren’t frequent, but when they happened you lost big.
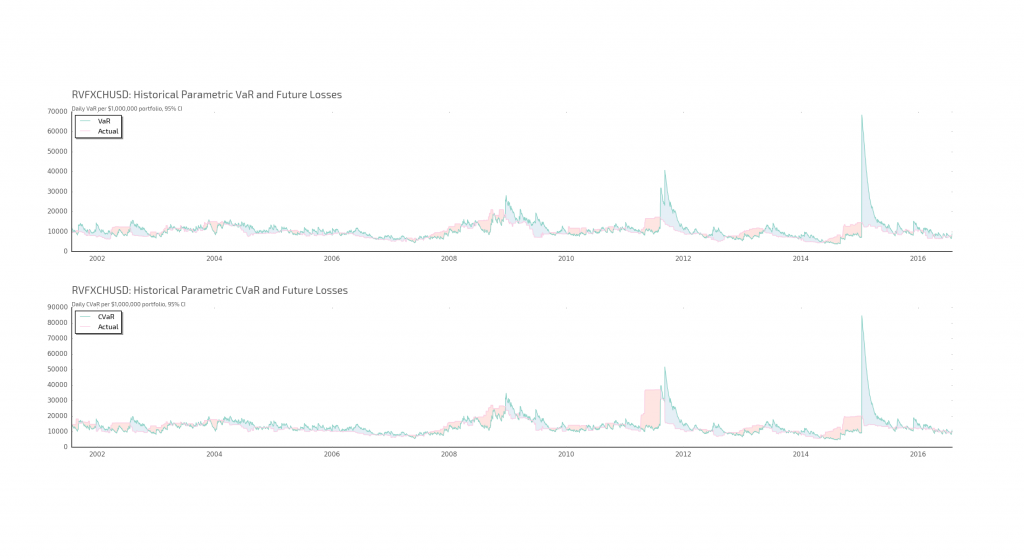
As a final exhibit we have CHF currency futures – and again we can see the excitement following on from the break of the CHF to EUR peg at the start of 2015 and the resultant hangover in significantly higher VaR/CVaR numbers for the following period – but without the corresponding actual losses going forward as the peg only broke once. Similarly to GBP we can see the difference between the actual VaR and CVaR figures around the SNB interventions in 2011/2. Again while the interventions weren’t frequent, when they happened you generally lost big – which is perhaps the point of central bank interventions/statements.
So all very good but what do we take away from this? Fundamentally is VaR a useful tool? And is CVaR actually any better? I think the answer to both is ‘sometimes’. Even the basic VaR model can provide a useful handle on the current risks of a complex portfolio – and that’s before you start getting into the various improvements and enhancements that have been proposed over time. CVaR, while not an overall fix is certainly an incremental improvement giving you more information about the likely size of losses. Overall as long as the market dynamics are roughly comparable going forward VaR/CVaR are useful summary measures. What both measures can’t do however is forecast major change – this might seem like an obvious statement, but one that anyone who uses VaR in all its forms needs to be continually mindful of.
Is there an answer to forecasting these major risks? In short, not really, and frankly if I knew I’d rather be calling my broker rather than be telling you… What you can do is look at the past and see where VaR has ‘failed’ – mainly the red and blue areas of the charts, and perhaps let the magnitude of these events guide your expectation of how bad things could get, or by how much your VaR might be overstated. Alternatively, you could use your imagination and come up with scenarios of what might happen in the future – especially if there are major events such as a US Election or a UK Referendum coming up. You could call it scenario analysis or stress testing and as long as your scenarios were plausible they should give you some more information.
In conclusion, and in my personal experience, risk managers tend to spend a lot of their time getting, fixing, analysing and in some cases over-analysing data – be it VaR, CVaR, scenario analysis or advanced versions of them. While it’s useful to have lots of correct information, you need to understand the calculations and limitations of each measure if you are really going to get a handle on your risk. Automate what you can to get sensible numbers presented in a simple way, but leave plenty of time to actually think about the numbers and what else might be lurking around the corner.
Further Reading: This is not a small topic and one with more references than I can possibly imagine. My answer is to ask for you, dear readers, to benefit the community by posting your favourite links to pieces you’ve enjoyed in the comments below. I’ll start you off with a link to Nassim Taleb’s various tomes on the subject – enjoy.
1 Yes I admit 90 days in the future is a long time to use as a comparative VaR number, however it does mean there is a reasonable sample size and the graphs look nicer… call it poetic licence.